Global seafood demand has bounced back strongly in the post Covid-19 period, adding US $13 billion of trade in 2021, driven by growing demand for high-value seafood in the United States, EU and China, according to the World Seafood Trade Map 2022 report published by Rabobank. This soaring demand for fishery and aquaculture products has positioned seafood as the most traded animal protein, with an estimated value of US $164 billion in 2021 and a 2.44% compound annual growth rate (2011-2021).
Data in the recently issued Seafood Trade Map 2022 was analyzed and detailed in report co-authored by Rabobank Seafood Analyst Novel Sharma Senior Seafood Analyst Gorjan Nikolik.
In 2021, seafood trade was roughly 3.6 times the size of beef trade (the second most traded animal protein), five times the size of global pork trade, and eight times the size of poultry trade.
Global seafood trade is characterized by a broad diversity of products, with each having its own export and import markets. There are 55 trade flows that are each valued at over $400 million per year, and an additional 19 trade flows that are worth between $200 million and $400 million, illustrating the international nature and diversity of seafood trade (see map above).
Developing countries play a major role in seafood exports, accounting for seven of the top ten exporters. Developed countries are increasingly reliant on developing nations for imports of high-value species, especially shrimp from India and Ecuador and salmonids from Chile. A more detailed look into specific trade flows reveals that trade from Norway to the EU-27+UK retains the top spot, valued at over $8.7 billion and largely comprised of farmed salmon. In second place, the report finds trade from Canada to the United States, valued at $5 billion and dominated by crustaceans (excluding shrimp), which are valued at $3.34 billion. And with more than $3.3 billion worth of seafood in 2021, trade from India to the United States comes in third place, driven by demand for farmed Vannamei shrimp, which make up 80% of Indian seafood exports to the USA.
Combined Seafood Imports by EU, USA and China Surpass $80 Billion
The combined imports of the United States, China, and EU-27+UK are valued at $80 billion, roughly 50% of total seafood trade in 2021. The EU-27+UK remains the largest seafood buyer by value, importing over $34 billion worth of products in 2021. However, since 2013, it has grown at a CAGR of only 2%, while in the last five years the United States and China exhibited CAGRs of 6% and 10%, respectively, each roughly doubling the total value of their imports.
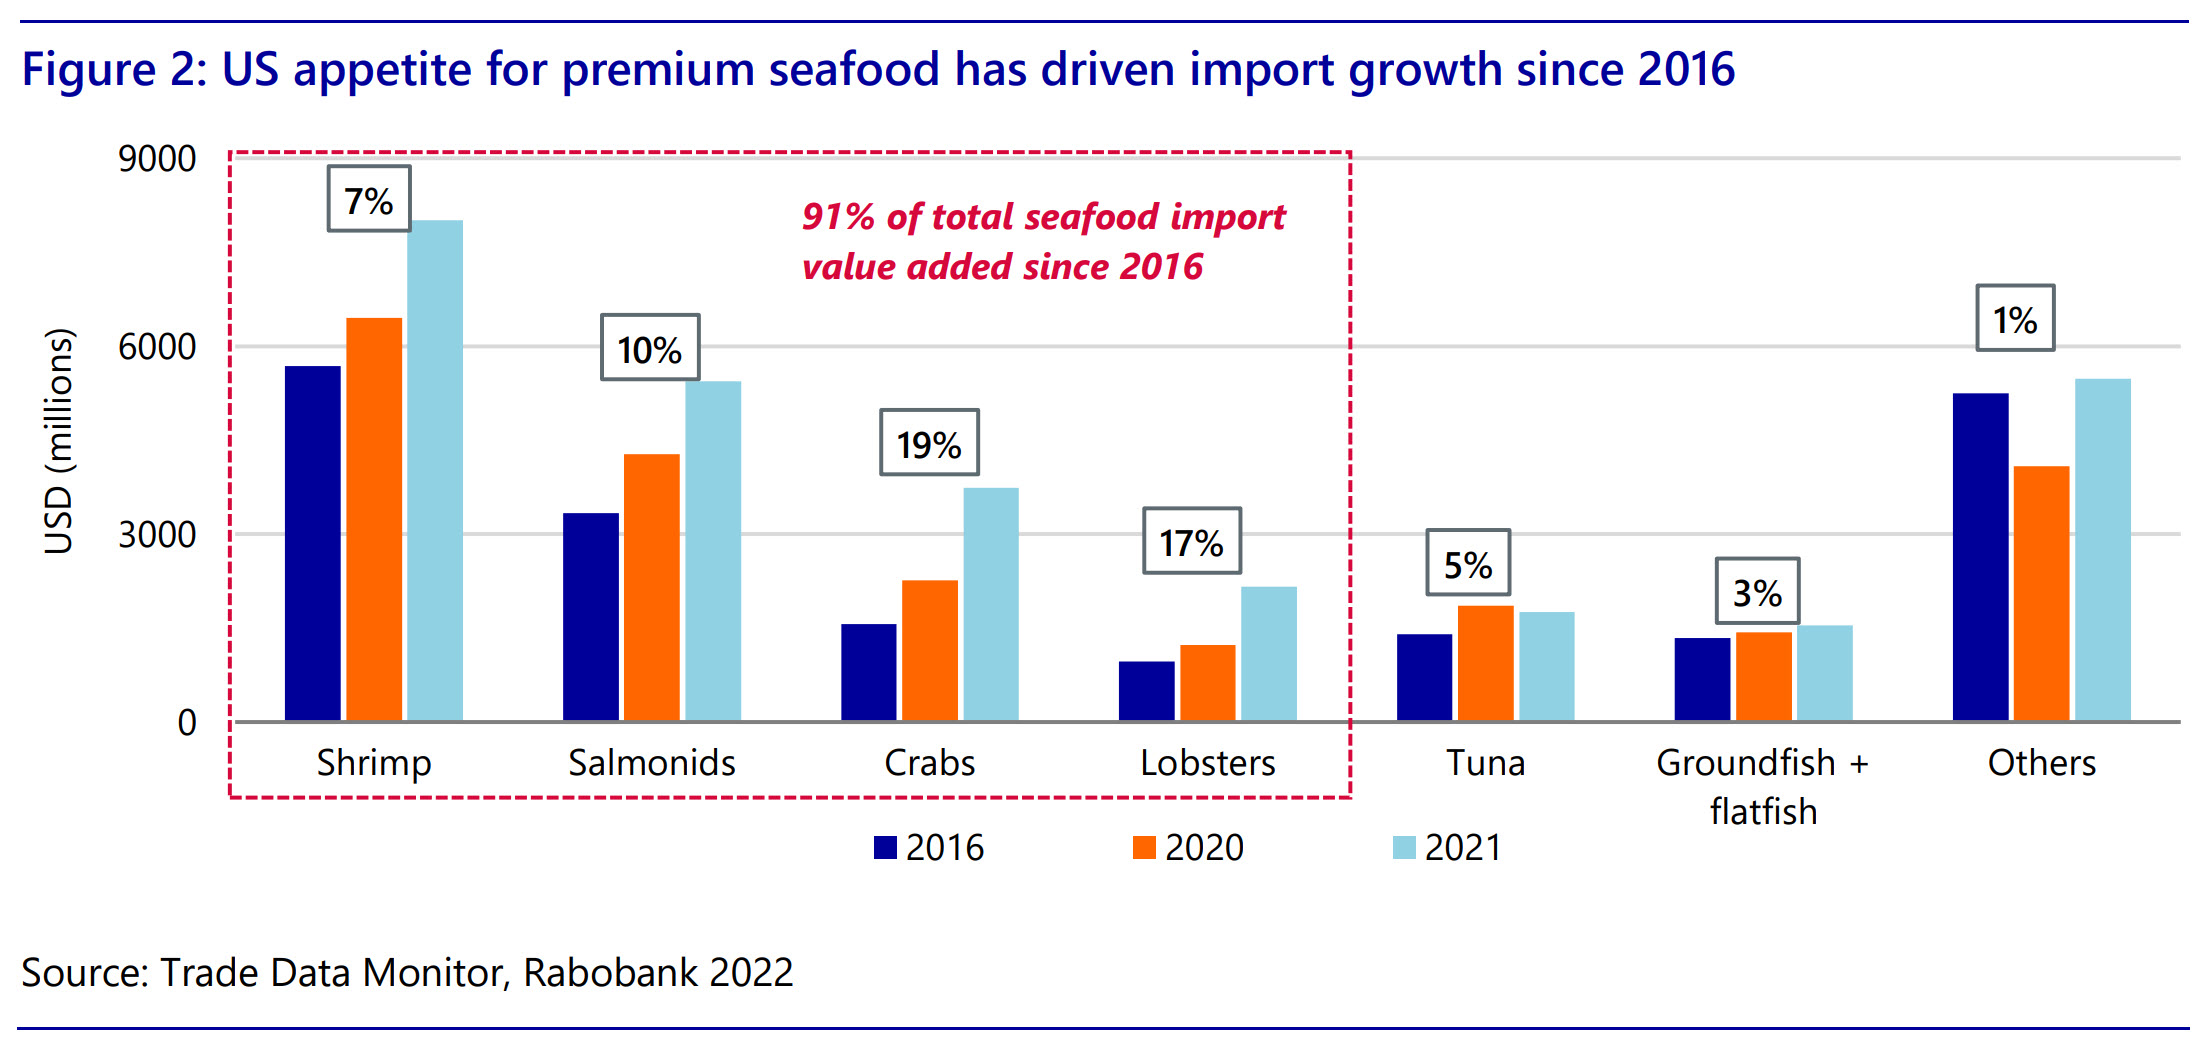
Appetite for Premium Seafood in USA and China Drives Trade Growth
As of 2021, total seafood imports by the United States were valued at $28.1 billion – or $8.6 billion higher than 2016 total imports – driven by shrimp, salmonids, crabs and lobsters, which account for 91% of total value added products. Demand for premium seafood in the United States is visible in the nation’s increasing imports of shrimp, salmonids, and crabs, which exhibited value CAGRs (2016-2021) of 7.1%, 10.3%, and 19%, respectively (see Figure 2 ).
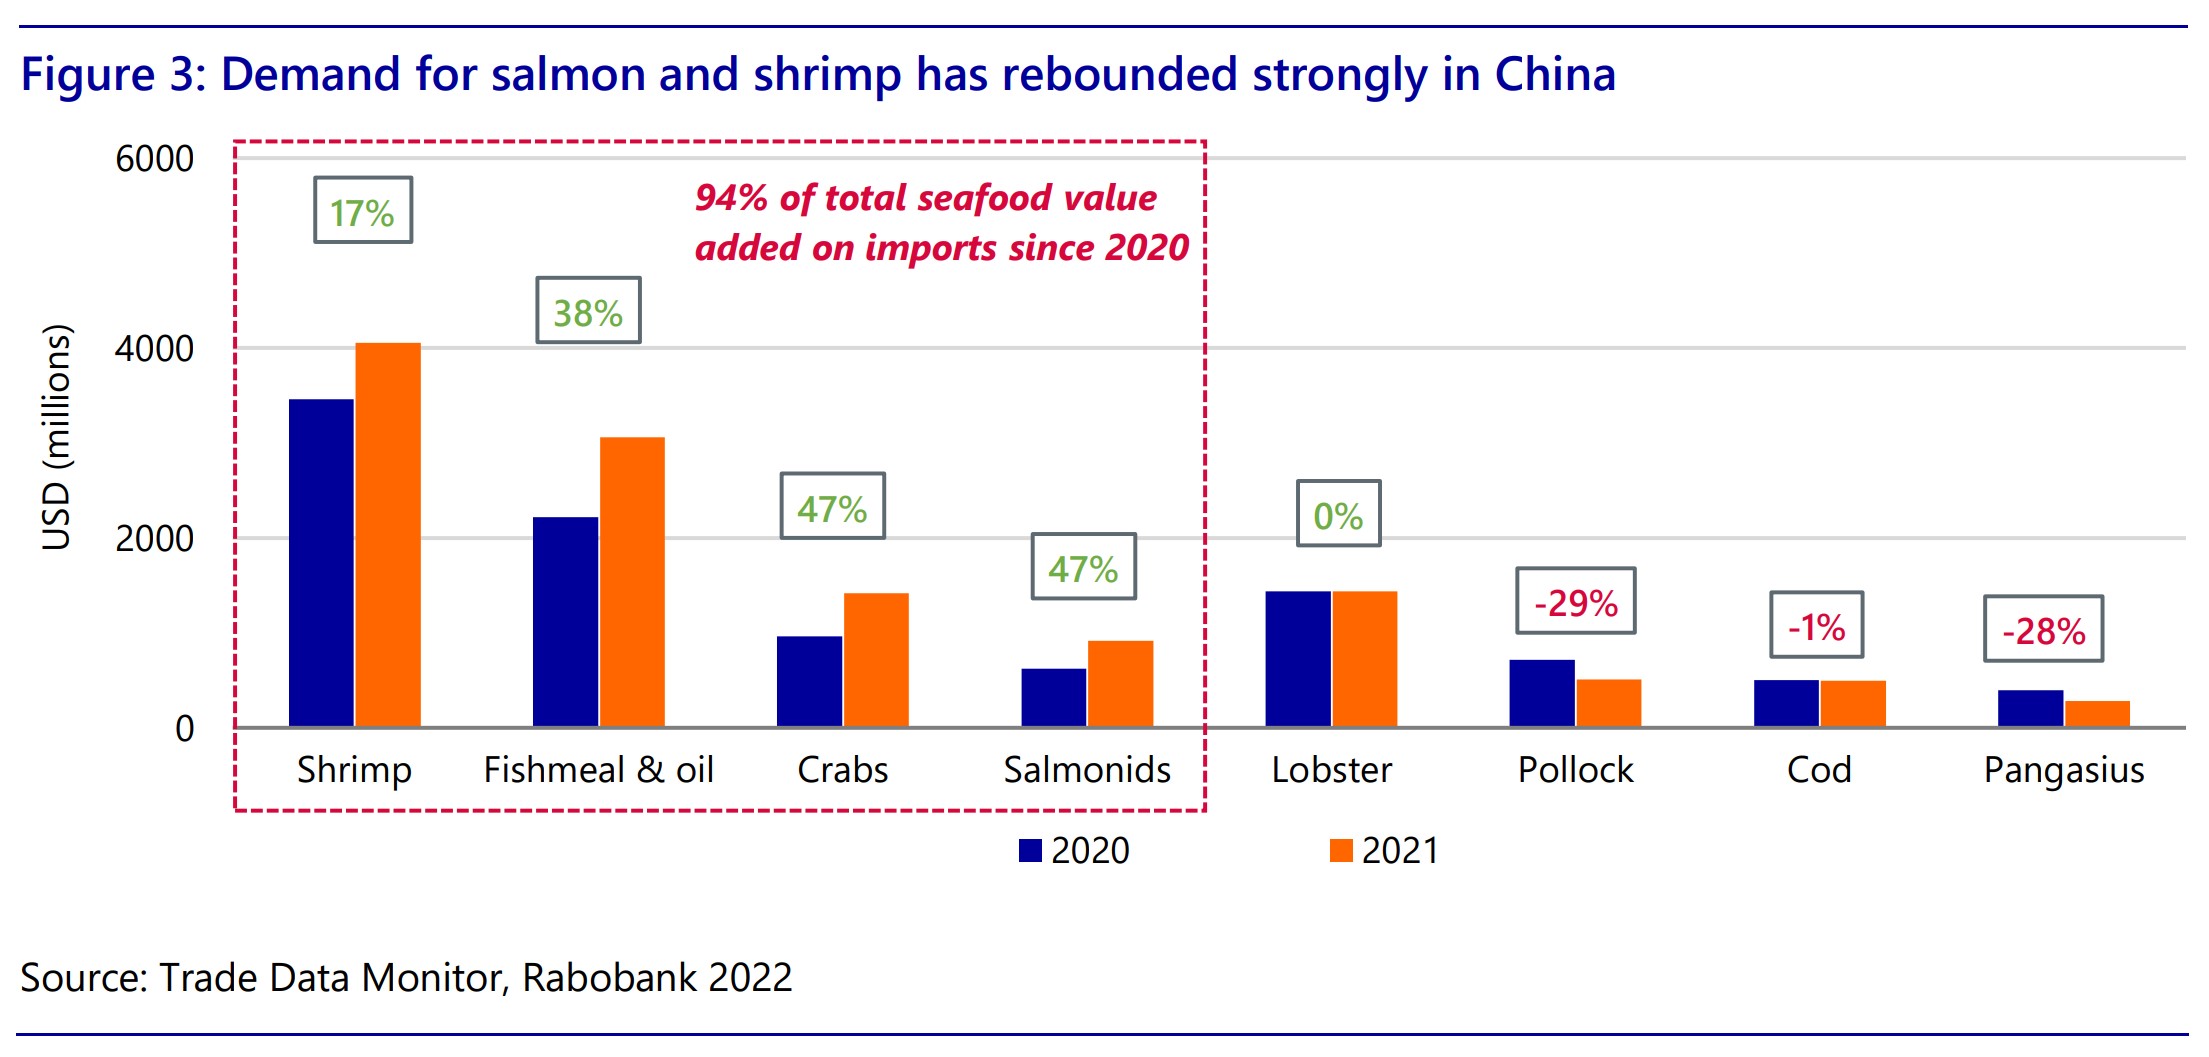
In 2021, China’s seafood imports were valued at $17.2 billion. From 2013 to 2021, the nation’s import volumes exhibited a CAGR of 4.4%, while import values had a CAGR of 10.1%, highlighting the demand shift to more expensive forms of seafood protein. This trend is further evidenced by the strong rebound in imports in 2021 that followed the initial Covid-19 lockdowns and added $2.4 billion compared to 2020. This growth was driven by shrimp, fishmeal, crabs and salmonids, all of which exhibited high double-digit year-on-year growth and together accounted for 94% of import growth (see Figure 3).
High-Value Species will Drive Seafood Trade Growth
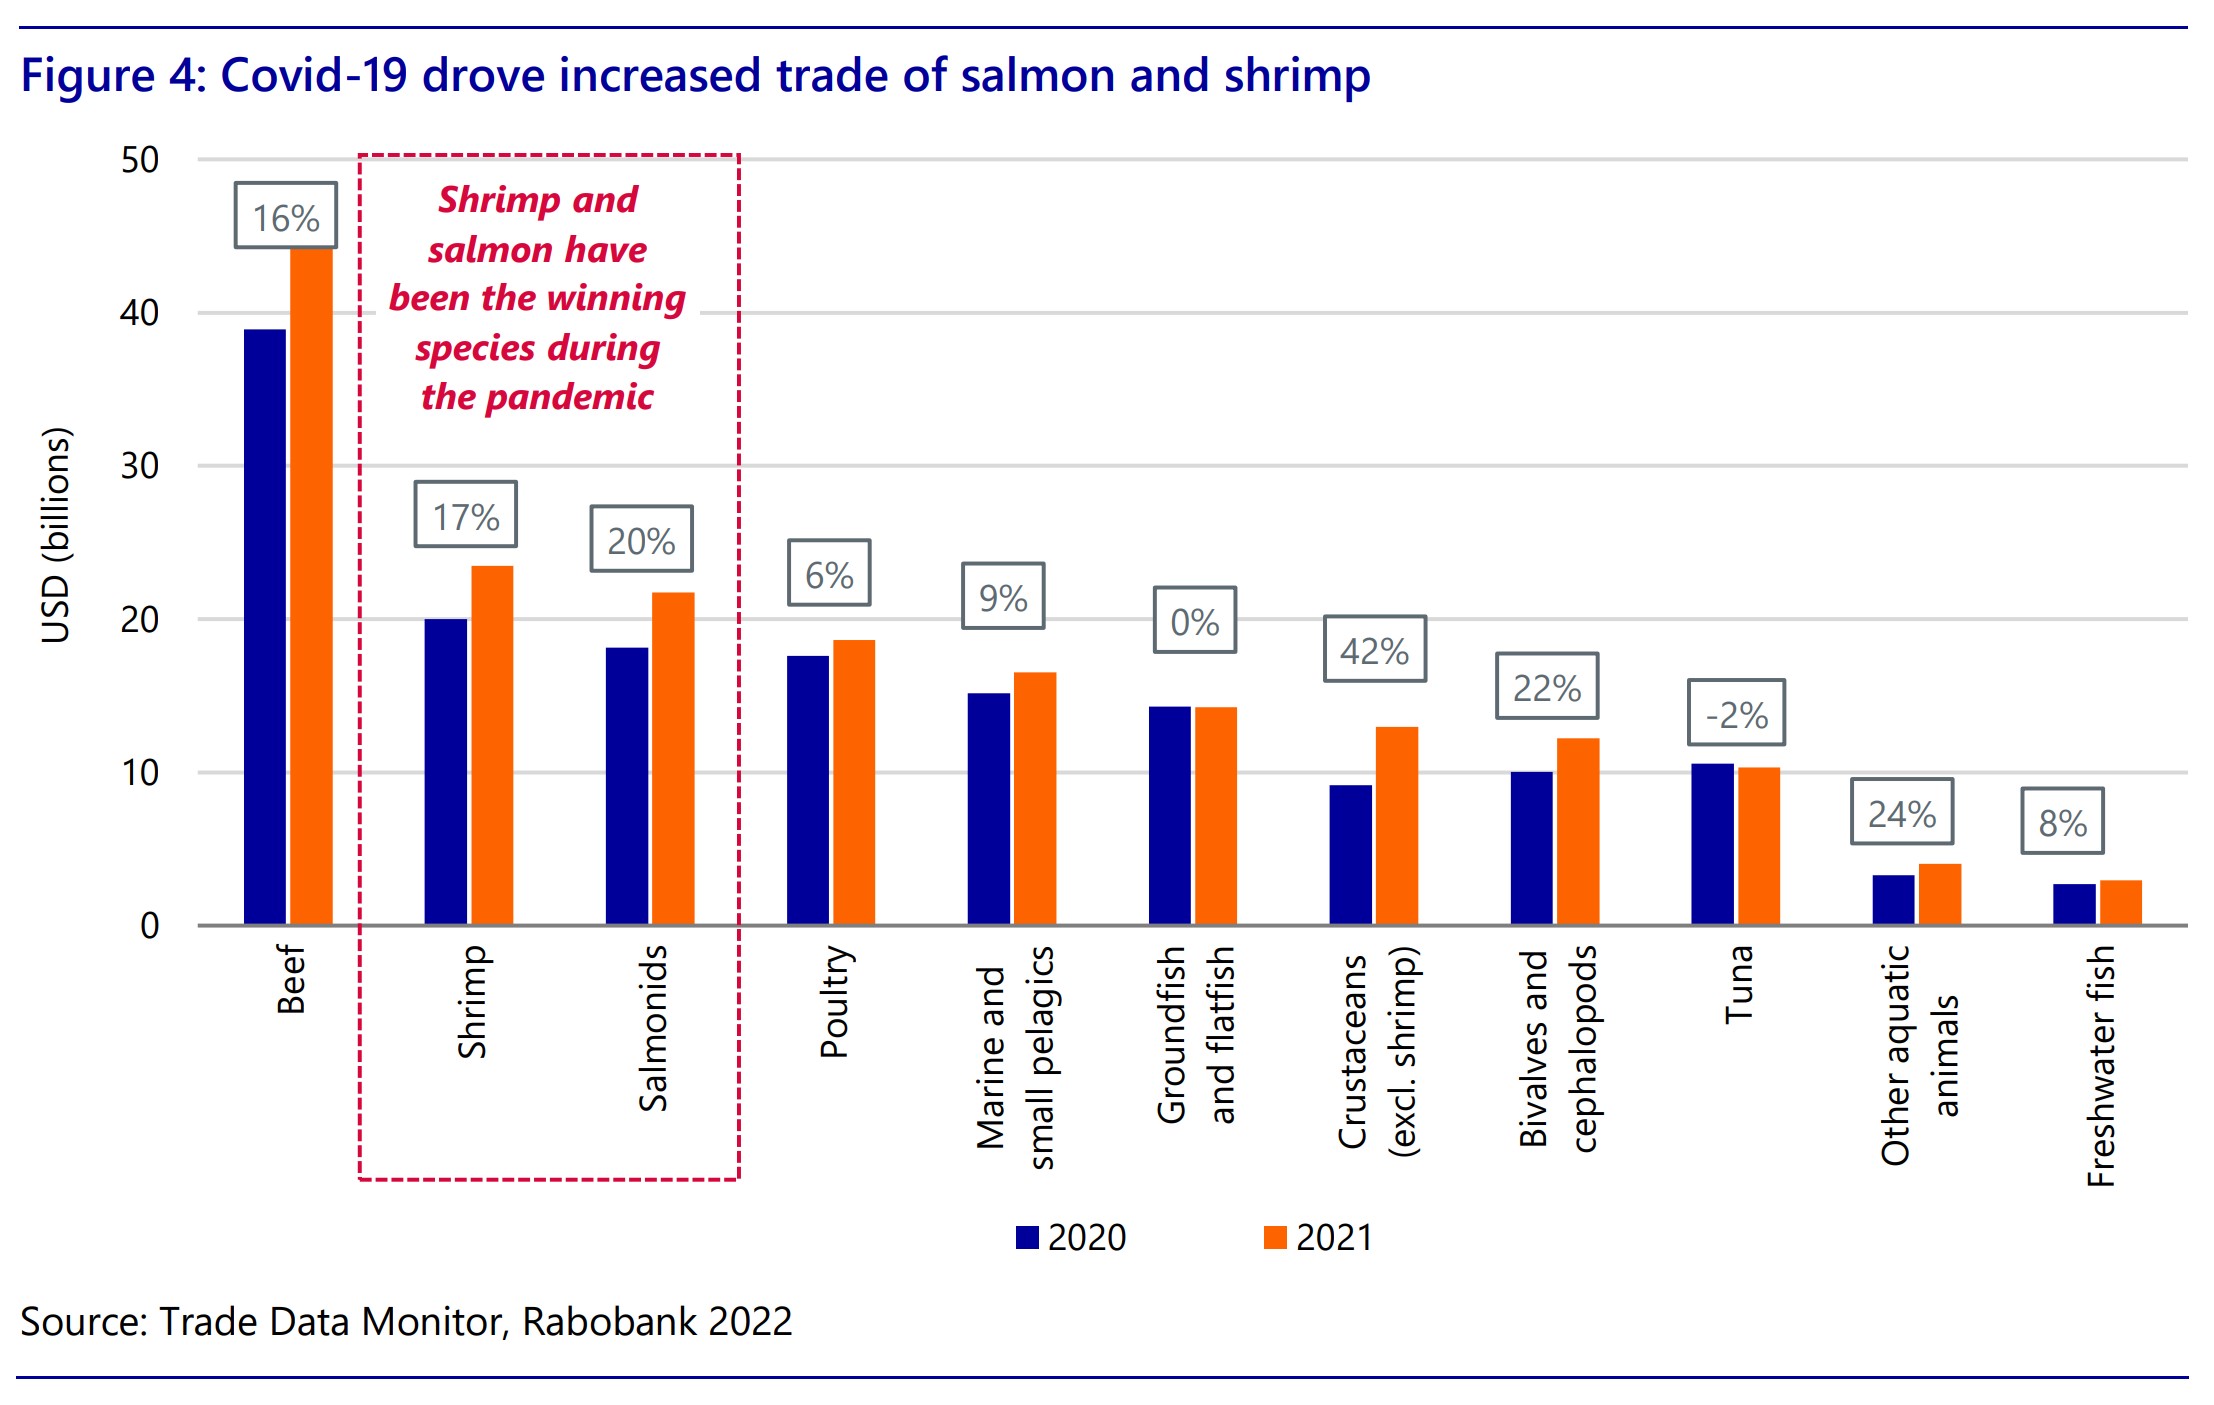
Since 2013, the winners of global seafood trade have been high-value species such as shrimp and salmonids, which exhibited volume CAGRs of 6% and 2% and value CAGRs of 3.3% and 2.8%, respectively. During the coronavirus pandemic, higher-value proteins such as beef, shrimp, and salmonids outperformed other proteins, with year-on-year growth in trade value of 16%, 17%, and 20%, respectively (see Figure 4).
It is expected that sustainability and demand for healthy and premium species will continue driving trade volumes of high-value seafood in the coming years, and exporters such as India and Ecuador are well positioned to capitalize on emerging trends and close the gap in the exporter rankings.
“We are also seeing unprecedented high prices for many seafood species due to challenges in international trade such as rising freight and energy costs and continued lockdowns in China,” noted the report’s authors. “However, recent data suggests the impact on seafood demand may become material, especially if a recessionary environment develops in the second half of 2022 or 2023. This could affect seafood market prices and the value of trade flows. To conclude, seafood is not only a healthy protein important for food security, it also a key export commodity for many developing nations and a source of employment for millions of people.”